Commercial buildings are significant consumers of electrical power. Also, energy expenses are an increasing cost factor. Many companies therefore want to save money and reduce their power usage. Building administrators have to first understand the power consumption behavior, before they can devise strategies to save energy. Secondly, sudden unexpected changes in power consumption may hint at device failures of critical technical infrastructure. The goal of our research is to enable the analyst to understand the power consumption behavior and to be aware of unexpected power consumption values.
In this project, we introduce a novel unsupervised anomaly detection algorithm and visualize the resulting anomaly scores to guide the analyst to important time points. Different possibilities for visualizing the power usage time series are presented, combined with a discussion of the design choices to encode the anomaly values. Our methods are applied to real-world time series of power consumption, logged in a hierarchical sensor network.
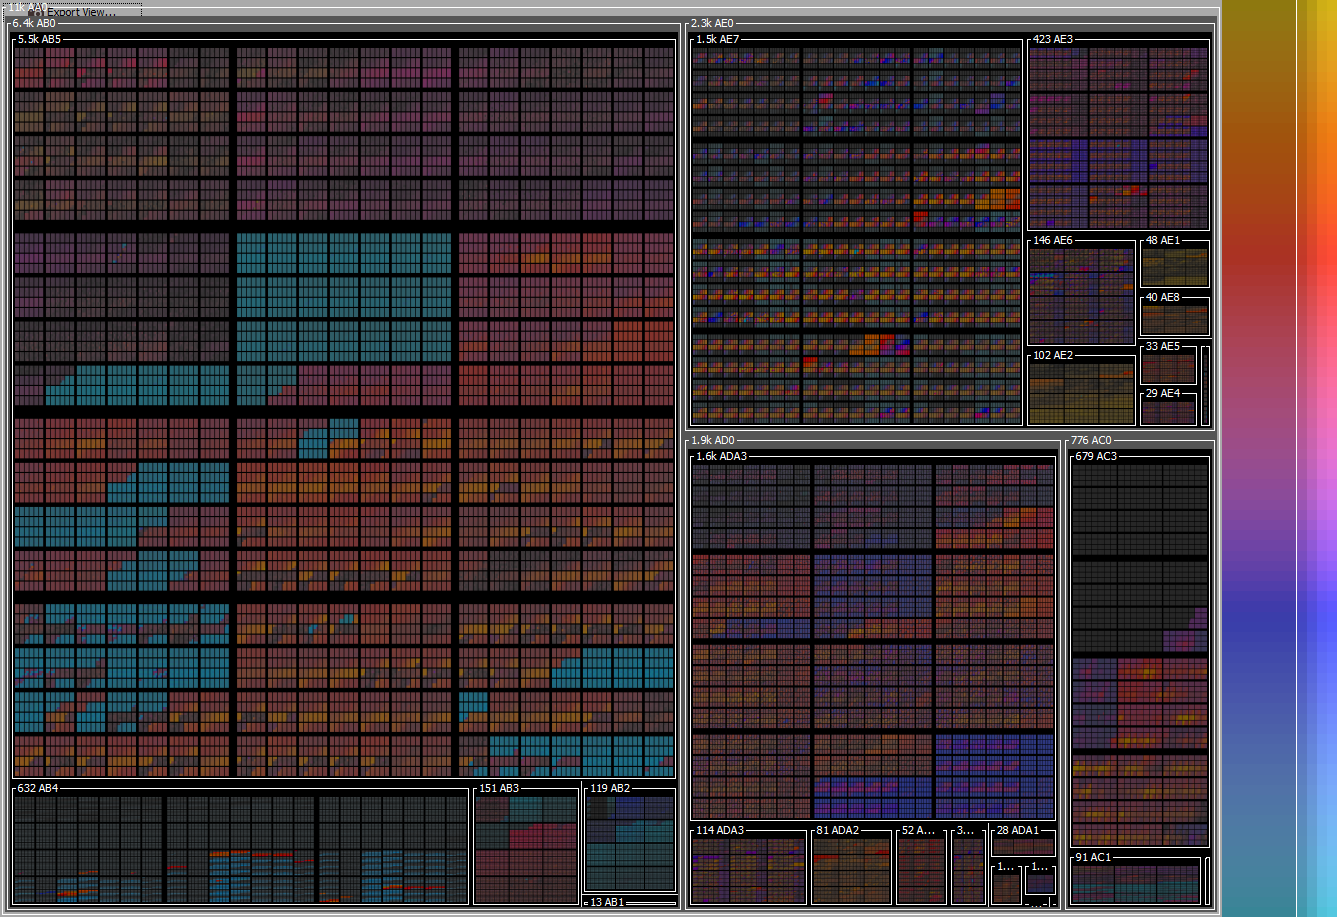
In the figure above, we performed an automatic anomaly detection algorithm and displayed the result using brightness and saturation in a space-filling pixel display.