Visualizing geospatial movement data by points is just an application for scatterplots. Scatterplots have the advantage being well-known and used often for visual analysis tasks, but at the same time have the problem of overplotting points in dense areas. We deal with this problem by moving overplotting points to the next free position in a meaningful manner.
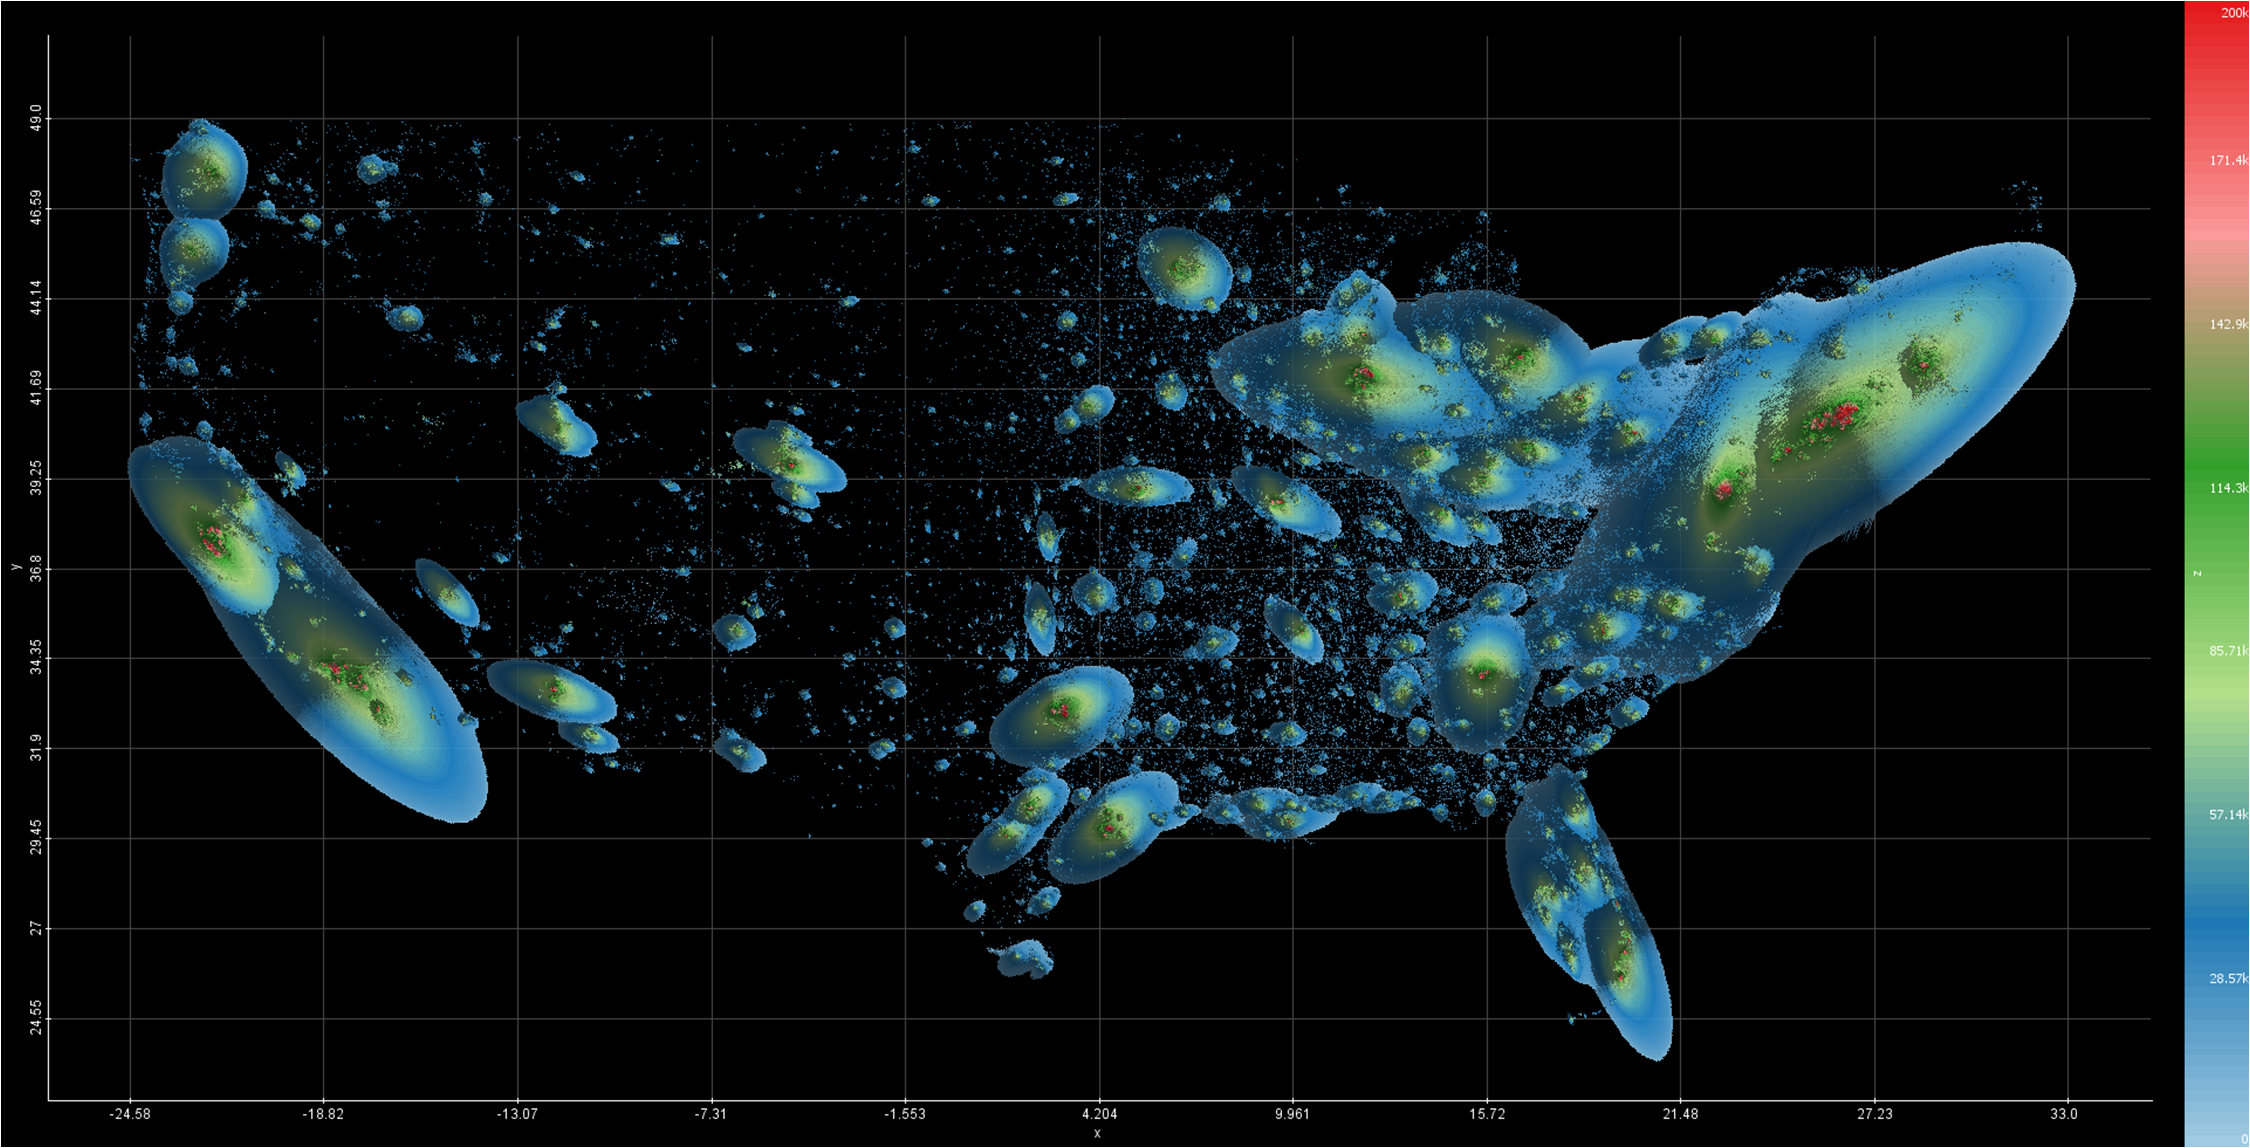
The figure above shows the result of our technique applied to a U.S. census data set. We first compute local correlations and use the correlation to determine the shape of the pixel placement. More in detail, we move overplotting points in an ellipsoid manner to the next free position, while the ellipse is determined by the direction and the strength of the correlation. In order to allow a distinction of nearby density clusters, we apply a lighting model to illuminate the scatterplot like a heightmap.